Infographics and Financial Decisions: An Eye- Tracking Experiment
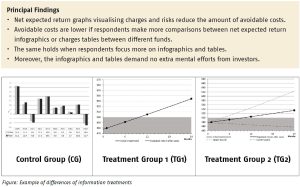
“Salient infographics help index mutual fund investors to minimise costs”
Consumers who save for their pension in a DC pension scheme and the self-employed often invest in index mutual funds. They tend to invest in expensive funds because they fail to take fund fees sufficiently into account. A Key Investor Information Document (KIID) is mandatory for many investment and insurance products in the EU. The KIID should make a fund’s costs and benefits clear. We used eye-tracking equipment to investigate how the saliency of infographics and tables in a KIID enables investors to make optimal investment decisions and minimise avoidable costs.
Key Takeaways for the Industry
- Replace the past return graph in the mandatory KIID with a net expected return graph.
- Easier graphical comparison of financial products enables untrained or inexperienced investors, in particular, to reduce avoidable costs.
Want to know more?
Read the paper ‘Infographics and Financial Decisions: An Eye-Tracking Experiment’ by Hong Phuoc (Michael) Vo, Reinier Cozijn and Peter de Goeij (Tilburg University)